Data Analytics
Zero-to-Hero program
This redesigned curriculum condenses the complete data analytics journey into an intensive 3-month program suitable for full-time learners or highly committed part-time students. Master Excel, Python, SQL, Tableau, Power BI, and build portfolio projects that land interviews.
Data Analytics as a Career
A high-growth career backed by real numbers.
Data analytics is one of the fastest-growing career fields in India. NASSCOM reports a 51% supply-demand gap for data professionals, with demand projected to exceed 1 million roles by 2026 and India's AI talent pool reaching 1.25 million by 2027.
Fuelled by Digital India initiatives, 5G rollout, and rapid cloud adoption, India's data analytics market is set to reach $27 billion by 2033. With a clear career ladder from Rs 4 LPA at entry level to Rs 50L+ at the director level, there has never been a better time to invest in data analytics skills.
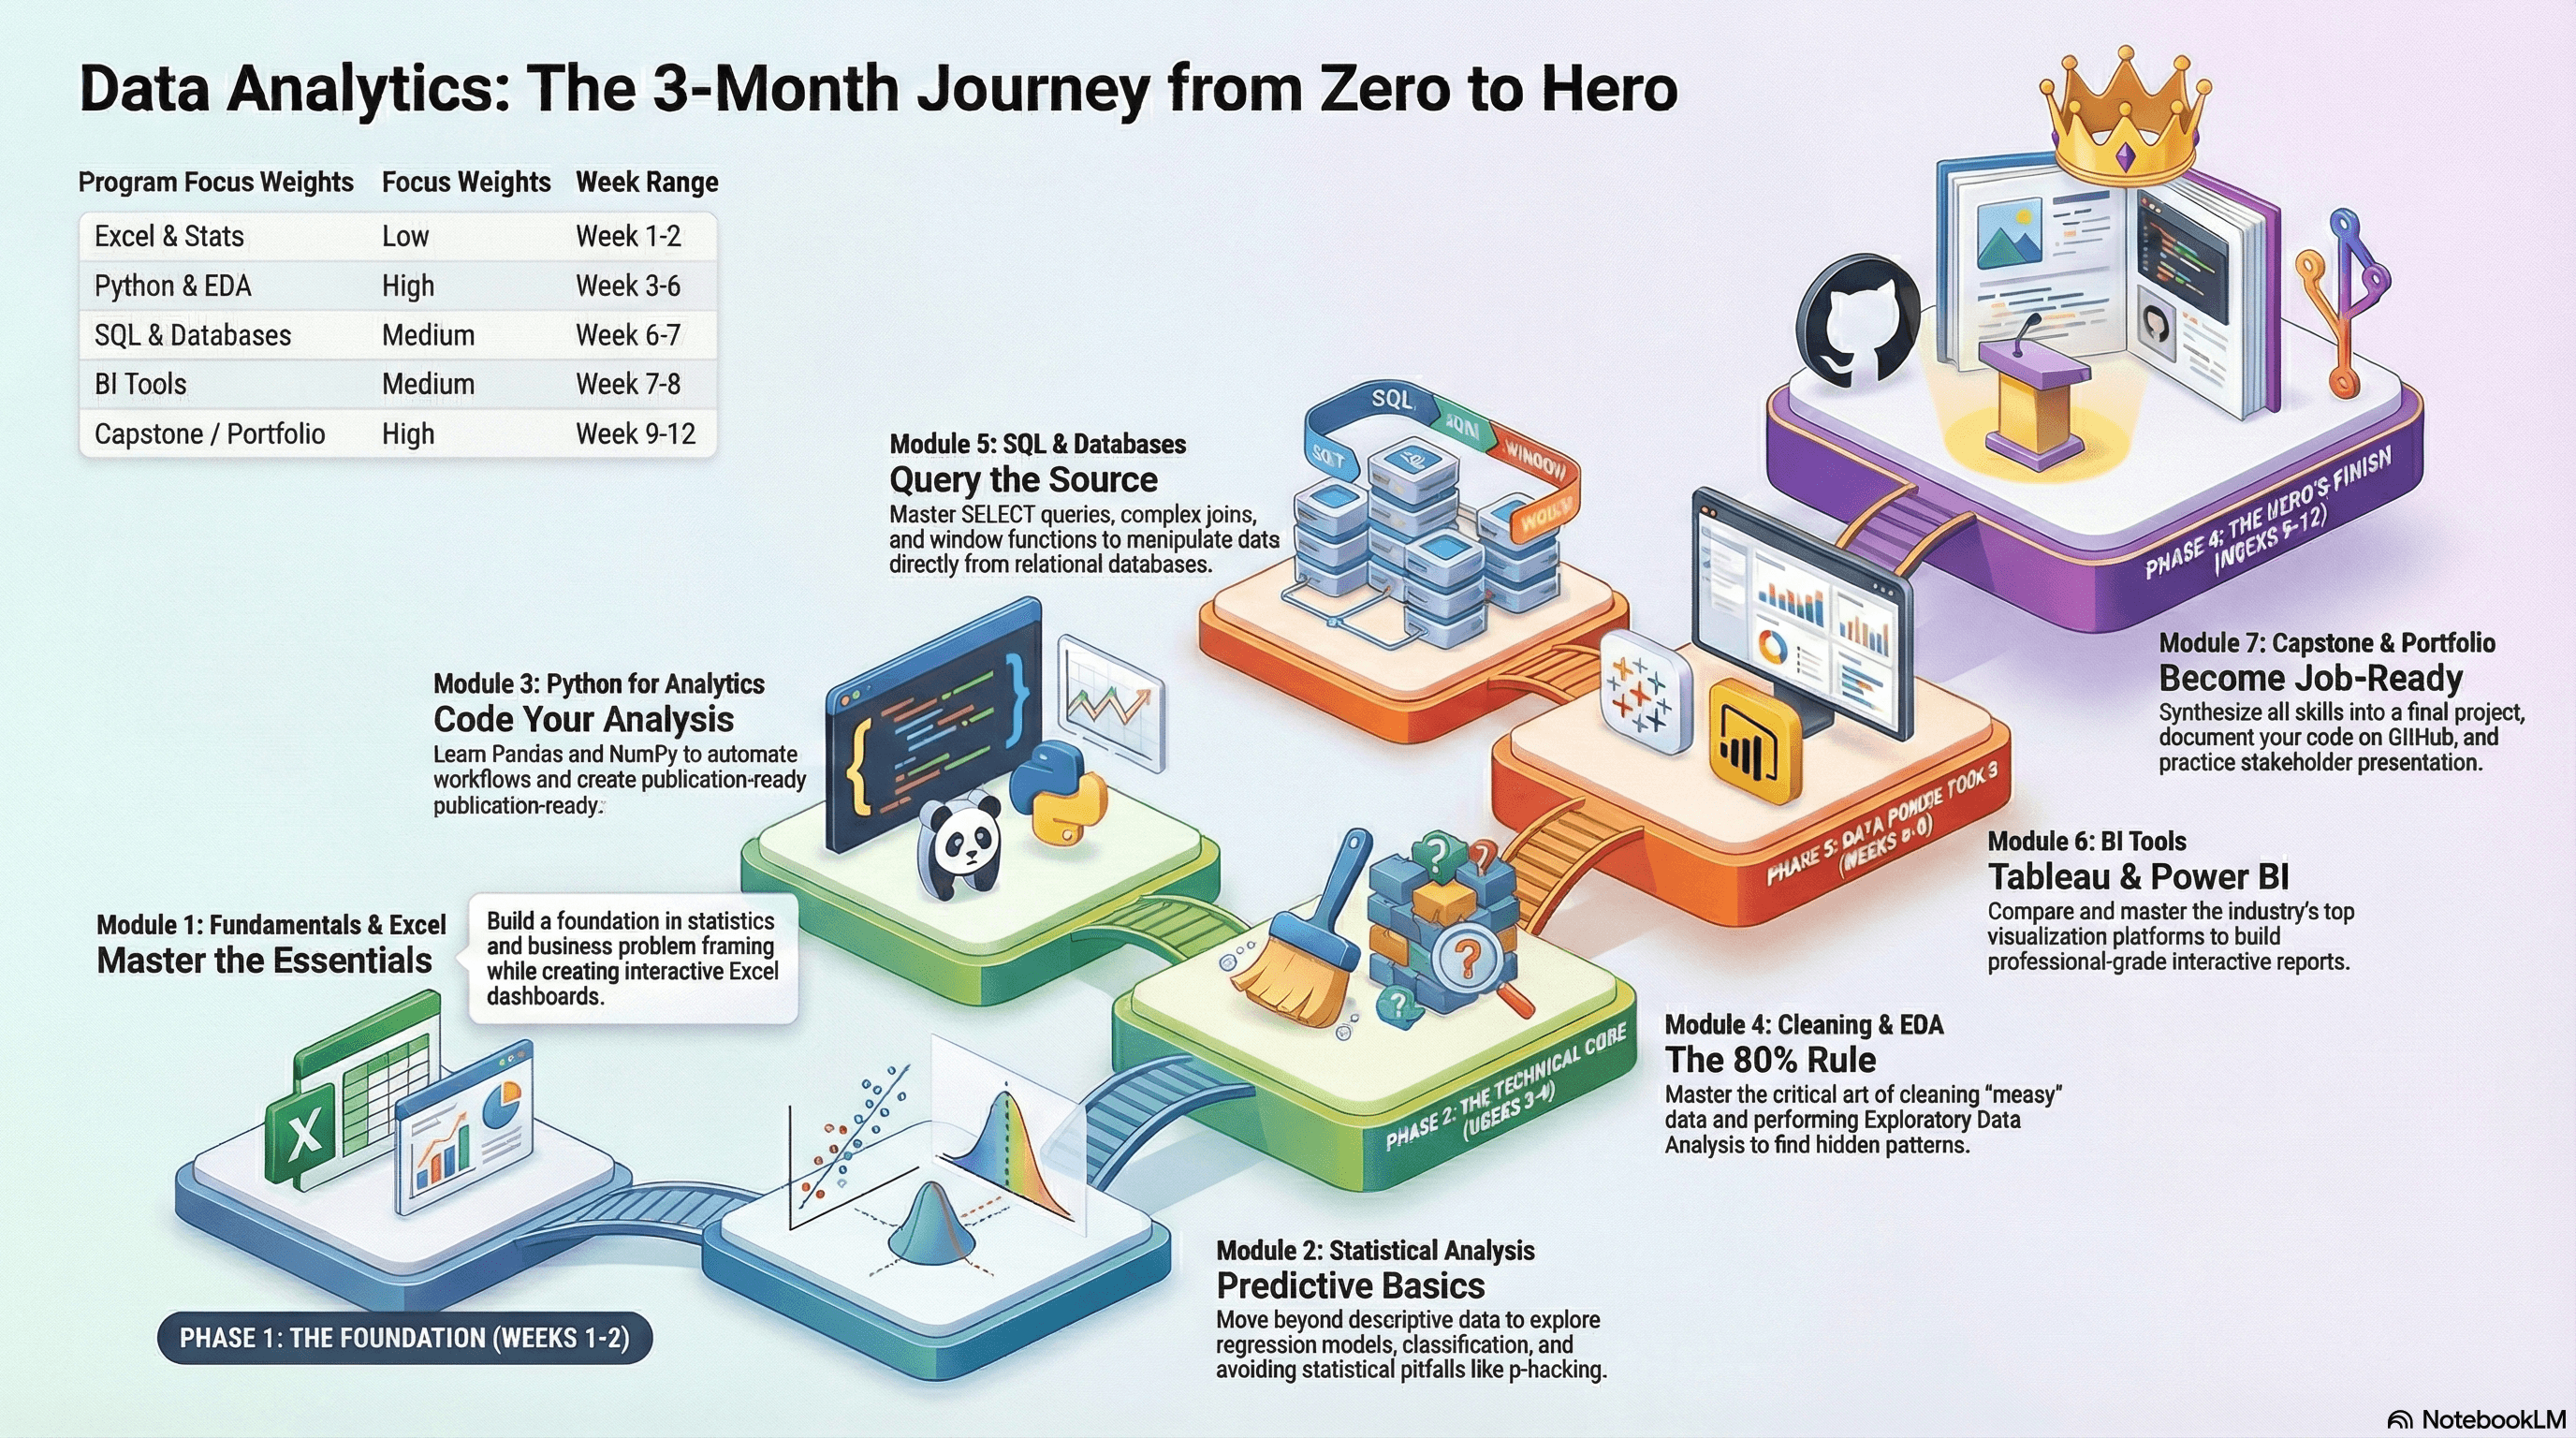
Curriculum Breakdown
Your 3-month roadmap to becoming a job-ready Data Analyst.
Data Analytics Fundamentals & Excel Mastery
Build the essential foundation and master the most widely-used analytics tool in business organizations
Statistical Analysis & Predictive Basics
Move beyond descriptive analytics to predictive modeling fundamentals.
Python for Data Analytics
Learn programming fundamentals specifically tailored to data manipulation and analysis tasks.
Data Cleaning, Preparation & EDA
Learn the critical skills that consume 60-80% of real analyst work - preparing messy data for analysis.
SQL and Database Querying
Master the universal language for accessing and manipulating data from relational databases.
Business Intelligence Tools - Tableau & Power BI
Master the industry-standard visualization platforms for creating interactive dashboards and reports.
Capstone Project & Portfolio Development
Synthesize all skills into a comprehensive capstone project that demonstrates job readiness.
Tools & Technologies Covered
Industry-standard tools you will master in this program.
Ready to start your Zero-to-Hero journey?
Get in touch to learn more about our 3-month intensive bootcamp programs. We'll help you choose the right path for your career.